Introduction
Chat Widget performance optimization follows our recent changes in the area of accessibility. “Why bother improving performance?” you might think. After all, we addressed our customers' concern that LiveChat potentially slows down their websites a long time ago, assuring our customers that LiveChat has as little impact on the performance of their websites as possible.
Yet, Largest Contentful Paint (LCP) has become one of the key factors influencing page ranking in Google. LCP captures a particular aspect of page load speed — it marks the time at which the first text or image is painted on a page. Businesses do their best to optimize their websites to increase page speed and, as a result, outrank competitors. We want to stay ahead of the curve at LiveChat, and that's why we’ve made several improvements to the performance of our Chat Widget.
We rang the changes in the following areas: chat widget asset size, Largest Contentful Paint, and Cumulative Layout Shift (CLS). Spoiler alert: It was worth it.
Technological improvements
Here's a brief overview of the technological improvements we’ve implemented. Some of them, like code splitting, turned out to be successful while others had negligible impact.
Code splitting
Code splitting was a game-changer when it came to reducing both the Chat Widget asset size and its loading speed. From now on, the initial script of our Chat Widget doesn't contain the code required to show the Chat Widget in full. Instead, that code is loaded when the user hovers over the minimized chat widget.
Replacing SockJS with a pure WebSocket connection
Our Chat Widget used to implement SockJS, a wrapper on WebSocket (WS) connections. While it is true that SockJS came with out-of-the-box solutions, such as reconnect logic and the XHR fallback mechanism, the benefits of switching to a pure WS connection outweighed the cost of migration. Here’s what was gained from this change:
- By eliminating SockJS from our stack, we saved the time that used to be spent on loading this library, as well as reduced the widget bundle size by 18KB.
- We cut out a request SockJS used to make to our servers in order to get a specific configuration, which won us some additional time.
This change has significantly decreased the Chat Widget loading speed and its asset size.
HTTP/2 and request parallelization
Migrating to HTTP/2 from HTTP/1.x opens up numerous possibilities to optimize app performance without compromising its robustness. One of the options HTTP/2 gives is the possibility to make multiple parallel requests, which was problematic in HTTP/1.x as one had to use multiple TCP connections. HTTP/2 removes these limitations. The migration reduced Chat Widget's initial load time but not in a particularly significant way, which makes it difficult to measure. Nevertheless, it was worth the effort as every millisecond matters.
Chat Widget asset size
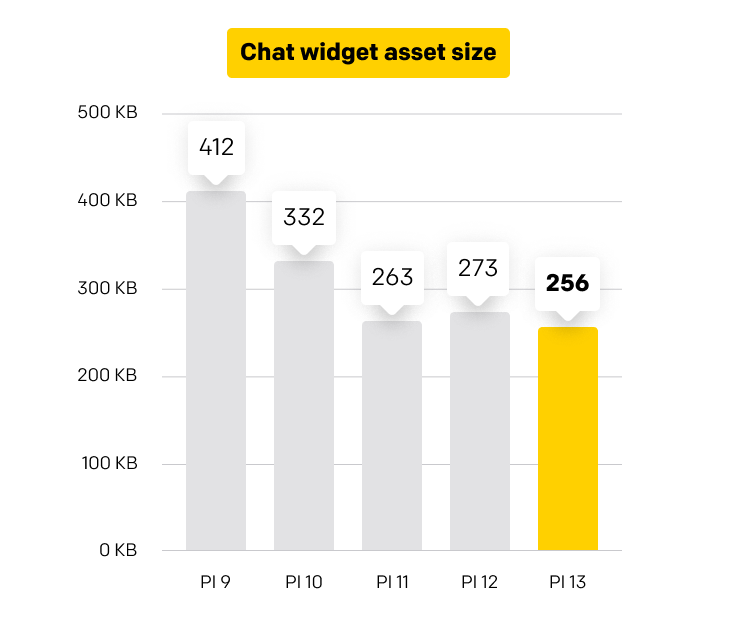
If we put the Chat Widget asset size measured by Google Lighthouse on a timeline, we started with a chat widget size of 412KB in June 2020 (PI 9 on the chart below). We gradually reduced the total size to 332KB and 263KB in the first two stages. After a minor setback that increased the size to 273KB in the next stage, we reached a point where our current chat widget asset size has settled at 256KB. All in all, we reduced the overall chat widget size by 18% (71.62KB) and significantly shortened the loading time of the Chat Widget.
First Contentful Paint
First Contentful Paint gives you an idea of when users receive consumable information (text, visuals, etc.). It's much more than First Paint, which measures the time of the first render – any render – detected in the browser (like a background color, which isn't very informative).
Keeping track of FCP is crucial as we're dealing with the consumption of customer's resources. We wanted to ensure that our Chat Widget has as little impact on the FCP of the customer's website as possible and that the Widget itself is accessible for users in no time.
An even more meaningful metric is Largest Contentful Paint (LCP). This measures how long it takes for the largest content element (a hero image, heading text, etc.) to become visible for page viewers. To provide a good user experience, 1.2 seconds or less is necessary. We tested this metric on a sample page that each LiveChat license can open in Chat Settings from the LiveChat Application. The result was 252 ms. 🎉
Chat Widget Cumulative Layout Shift
According to web.dev,
CLS is an important, user-centric metric for measuring visual stability because it helps quantify how often users experience unexpected layout shifts — a low CLS helps ensure that the page is delightful.
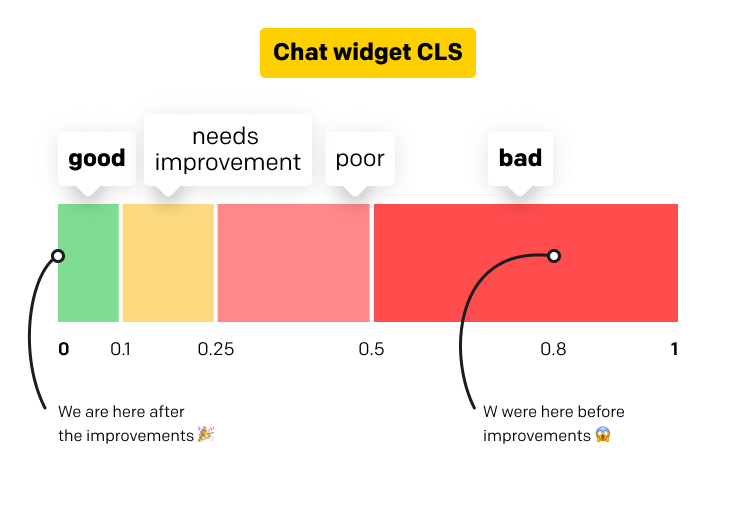
We managed to reduce the CLS impact reported by Google Lighthouse from 0.8 to 0, which translated into lowering the number of CLS issues reported by our customers on the chat.
Key takeaways
All our research and optimization efforts bore fruit in the form of decreased widget asset size, LCP, and CLS. Code splitting and switching to pure WebSockets turned out to be the most effective technological changes, but migrating to HTTP/2 — despite the lack of sigificant positive results — is a starting point with great potential for future optimization. But even now, we are Grade A in the eyes of GTmetrix, which is quite an achievement. 👩🎓👨🎓
